A long-established arable enterprise benchmarking scheme is proving its value in meeting today’s farm productivity and viability improvement challenges. CPM gets an exclusive insight.
It’s the relative performance of individual crops on specific soil types that many growers find most valuable.
By Rob Jones
It may be more than 20 years ago, yet the late 1990s left an indelible mark on crop production thinking, as well as the knowledge the industry can meet even the stiffest of economic challenges.
Thankfully wheat at less than £60/t is a distant memory for many. But at the time the collapse in value of combinable cropping’s mainstay prompted unprecedented efforts to improve productivity. Amongst these was a novel approach, developed by a group of southern growers and their agronomists, using field performance data to understand how best to cope with such an existential threat.
Two decades on and Agrii’s Maximising Arable Performance (MAP) service extends to well over 30,000ha of annual cropping – with members across 15 different counties. It provides them with performance intelligence on all the main combinable crops from validated farm data, in thoroughly bottom-up benchmarking that has stood the test of time.
Members say this intelligence is proving invaluable in dealing with modern crop management challenges like blackgrass, cabbage stem flea beetle and BYDV, but also as a part of Agrii’s national Green Horizons Initiative – building wider business sustainability in the face of an increasingly uncertain climate and the biggest changes to farming support in a generation.
Wiltshire-based agronomist and regional technical adviser Tim Horton, who co-ordinates the scheme, says the secret of MAP’s success is being built up from field data rather than down from enterprise or farm records.
“Originally, we based our free customer service on the Crop Management Systems field recording package” he explains. “But now it can automatically be linked to Gatekeeper for seamless transfer of data. We are also developing it to work with Muddy Boots, although this is proving far from as straight-forward as we’d like it to be.
“As it comes in, our team validates the line-by-line field record information so there’s no ‘missing’ data. Any entries outside pre-set upper and lower limits are flagged-up and questioned. Input usage is also matched to farm purchasing and storage records,” he explains.
“In addition to ensuring the accuracy of the MAP database, our members find this cross-checking a real help in ensuring their record-keeping is as accurate as it can be for their ‘duty of care’, together with any external auditing.
“As a rule, we close data entry towards the end of each calendar year to allow enough time from harvest for the most accurate performance records. We then apply standardised output prices according to actual crop quality to ensure the results reflect production efficiency rather than being skewed by any market differences. Finally, we feed each member’s results back to them in a confidential January report benchmarking their performance in a whole host of different ways,” he adds.
Tim believes this gives each grower/agronomist team the best possible crop-by-crop basis for assessing how their crops have performed against their peers, measuring the progress they’ve made from previous years, and pinpointing particular challenges they need to address.
So, what exactly does the benchmarking show about recent arable performance, and which elements do the farm teams find most valuable?
Detailed gross margin breakdowns are at the heart of the annal MAP farm report which typically runs to 60 pages. This enables the field performance of every major variable cost component as well as yield, output and margin to be compared for the 16 most widely-grown crops.
Separate comparisons are made for five main types of ground – chalk, clay, medium, light and brash soils. Wheat performance is benchmarked separately for milling, Group 3 and feed types. Winter wheat, winter oilseed rape, and winter and spring barley are further broken down by variety, with winter wheat and OSR also assessed by drilling date and previous cropping.
Finally, all the field data is combined, allowing overall harvested farm performance to be compared between farms of similar sizes and types by yield, variable cost and gross margin.
“The intelligence our farm teams gain from being able to see how their crops are performing compared with previous years, and against others in similar situations, in an accurate and thoroughly objective way is really valuable – as is the discipline of doing it,” adds Tim.
“Beyond this, analysis of the data over a number of years provides everyone with wider insights into the economic reliability of different crops, gross margin and cost trends, and the performance of different varieties or variety types – amongst other things – to help forward planning.”
It’s hardly surprising to see MAP showing milling wheat has been the best cereal margin earner over the past five years. More interestingly, it also reveals the crop to be less variable in its annual performance than Group 3 and feed wheats.
Furthermore, spring barley stands out (admittedly in a group of generally experienced spring barley growers) as being a much better and more reliable earner than winter barley. And while spring oats and spring wheat have delivered almost identical five-year average margins, it’s crystal clear from the data which is the least risky, he says.
MAP analyses of the economic performance of different crops over the past five years also tell an interesting story. Average and top 25% wheat gross margins show an encouragingly upward trend and a fairly consistent performance gap between them. It’s a very different picture with OSR – the growing challenges the crop has faced has seen margins fall and the gap between the average and better-performing crops increase.
“Looking into the data in more detail highlights the declining yields and increasing costs of OSR production in recent years,” notes Tim. “And more interestingly for forward-planning, earlier drilled crops are now performing noticeably better than those in what always used to be the more profitable, later-drilling windows.
“While sufficient commercial crop data is only now coming through, it’s also interesting to see TuYV-resistant varieties taking the top three mainstream ‘double low’ OSR performance slots. This is good confirmation of both our own variety trials and AHDB Recommended List results,” he comments.
“More data over a longer timescale is also highlighting the clear performance gap between hybrid six-row and conventional two-row winter barleys, in terms of margin as well as yield,” he adds. “Over the past three years, hybrids have delivered gross margins some 14% ahead of conventional two-row crops, together with less year-to-year variation.”
Drilling down further into the MAP data gives a good idea of how individual varieties are performing in terms of sustainability too. The current advantage of KWS Extase is clear, with an average fungicide spend of just over £79/ha in the 2020 season compared with an all-variety benchmark of over £92/ha – with previous stalwarts, Dunston and JB Diego, coming in at over £100/ha, highlights Tim.
“Our agronomist/grower teams find the ‘bigger picture’ they get from the data of great value in their improvement efforts. The first thing they invariably look at when they get the report is where their farm actually sits against the rest of the group, and how their position in the ‘league table’ may have changed.
“But it’s the relative performance of individual crops on their specific soil types that many growers find most valuable. This shows them the extent their achievements are in line with the group, so more due to the season than anything else. Where it’s out of line (one way or another) they can then delve further into the main margin components to find out why, and ask whether it’s more to do with yields, for instance, or input differences,” he explains.
“Their own data over a number of years provides farm teams with the best basis for future crop planning and budget setting too, and it provides the financial accountability that we have always seen as vital for agronomists.
“The group experience with different crops, varieties, input levels or drilling dates is equally important. It helps those involved make better-informed decisions about what to grow, when to sow and how best to manage. The great value here is knowing this intelligence is based on the most reliable field records.”
Quality intelligence underpins estate improvement
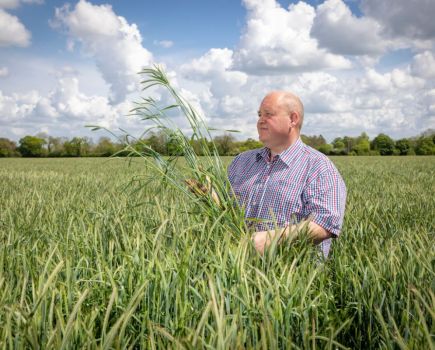
At Faccombe Estates on the Hampshire-Wiltshire border near Newbury, director Al Brooks finds his annual MAP benchmarking report a mine of valuable information, giving him vital season-by-season intelligence on his 1250 ha of cropping. It helps him identify areas for particular improvement attention and ensures his forward planning is based on solid facts, he says.
Al has made good use of the Agrii service ever since it was introduced, most recently as part of his four-year transformation of the estate’s farming business. He adds the proviso that any monitoring ‘falls or stands’ on the quality of the data behind it, so he takes particular care to ensure his Gatekeeper records are as comprehensive and accurate as they can be.
“Benchmarking each season’s performance against previous years and other businesses is hugely valuable, especially when we can drill down into individual varieties, soil types and categories of inputs to really see what’s going on. The value we get out of it is only as good as what we put in,” he says.
“The discipline of accurate record-keeping is something every member of our team appreciates and having our field records validated by Agrii helps keep us all up to the mark. While the headline MAP benchmarking comparisons only go up to gross margin level, we always record to net margin, allowing us to assess our performance as fully as we can.
“The league tables are the first thing I look at when our annual report arrives and they’re especially useful in providing context when reporting to the board,” notes Al. “They give us a good snapshot of how our crop performance compares with the overall season. If we have disappointing results in some areas but beat the season, we know we’ve done as well as we could have. But, if the disappointments are out of line with other results in that season, we clearly have things to address,” he says.
“The most important thing about MAP is that we can examine our performance crop by crop and line by line to identify the most profitable priorities for our improvement efforts. The benchmarking clearly highlighted the inconsistency of winter and spring barley performance across the estate over the years, leading us to drop them both.”
Being able interrogate the detail of the data to identify any inputs or costs out of line with past experience or local benchmarks is also particularly valued at Faccombe. Al finds it useful in a number of other ways, including tracking the relative performance of individual varieties to inform future seed decisions; seeing how the changes being made in cultivation and soil management practice are affecting the bottom line; and enabling future budget-setting to be as accurate as possible.
“There’s no replacing good data. It may tell you something you’d rather not hear, but you ignore it at your peril. With so much uncertainty in farming today, one thing we can be certain of, thanks to MAP, is that our decision-making is based on solid facts from the best available internal, as well as external, intelligence.”
Agri-intelligence update
The latest in our long-running series with the country’s most extensive agronomy R&D network gives CPM readers exclusive insights into exciting areas of Agrii’s Green Horizons initiative to improve the sustainability of UK food and farming in practical ways with the best scientific intelligence.
Each article explores an important facet of one of the initiative’s key priority actions being developed in detail in separate Insight Reports.
Benchmarking is an important element of the Increasing Farm Productivity & Viability report available from this autumn at www.agrii.co.uk/greenhorizons. This is complemented by the latest intelligence on extending rotations, innovative crops and technologies, better-targeted nutrition and building whole farm as well as soil resilience.