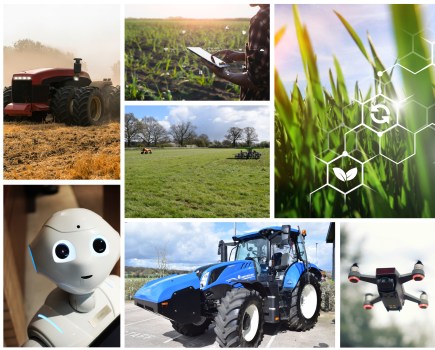
There’s now a new infrastructure that can draw in data to give valuable insight into your crop, farm or field, and may even deliver radical solutions for farming. CPM explores Agrimetrics.
The advances in data integration will benefit all those who contribute, often in unexpected ways.
By Tom Allen-Stevens
There’s an article that appeared in The Economist and it ended with this call to action:
So readers should take the following homework assignment for next year from this article: make an inventory of the data you are responsible for and think about which parts would be most likely to be re-used if you were to share them on a corporate intranet or on the internet. Just as in the early days of the web ten years ago, the advances in data integration will benefit all those who contribute, often in unexpected ways.
Chances are, as soon as you read the words “inventory of the data”, you probably concluded the call to action wasn’t directed at you and you wondered why on earth it was being repeated in CPM.
That’s until you consider a couple of details about the article: it was written by the inventor of the worldwide web Sir Tim Berners-Lee, and he wrote it in Nov 2006.
The article explains the concept of the Semantic Web (see panel below) to the uninformed, which was pretty much everyone in 2006. Today, it is the standard through which data is transferred and, critically, linked – as ubiquitous as the worldwide web itself – in nearly every industry, with one notable exception: agriculture.
“The agricultural community has more data than it realises,” says David Flanders, CEO of Agrimetrics. “The problem is that it’s completely siloed.”
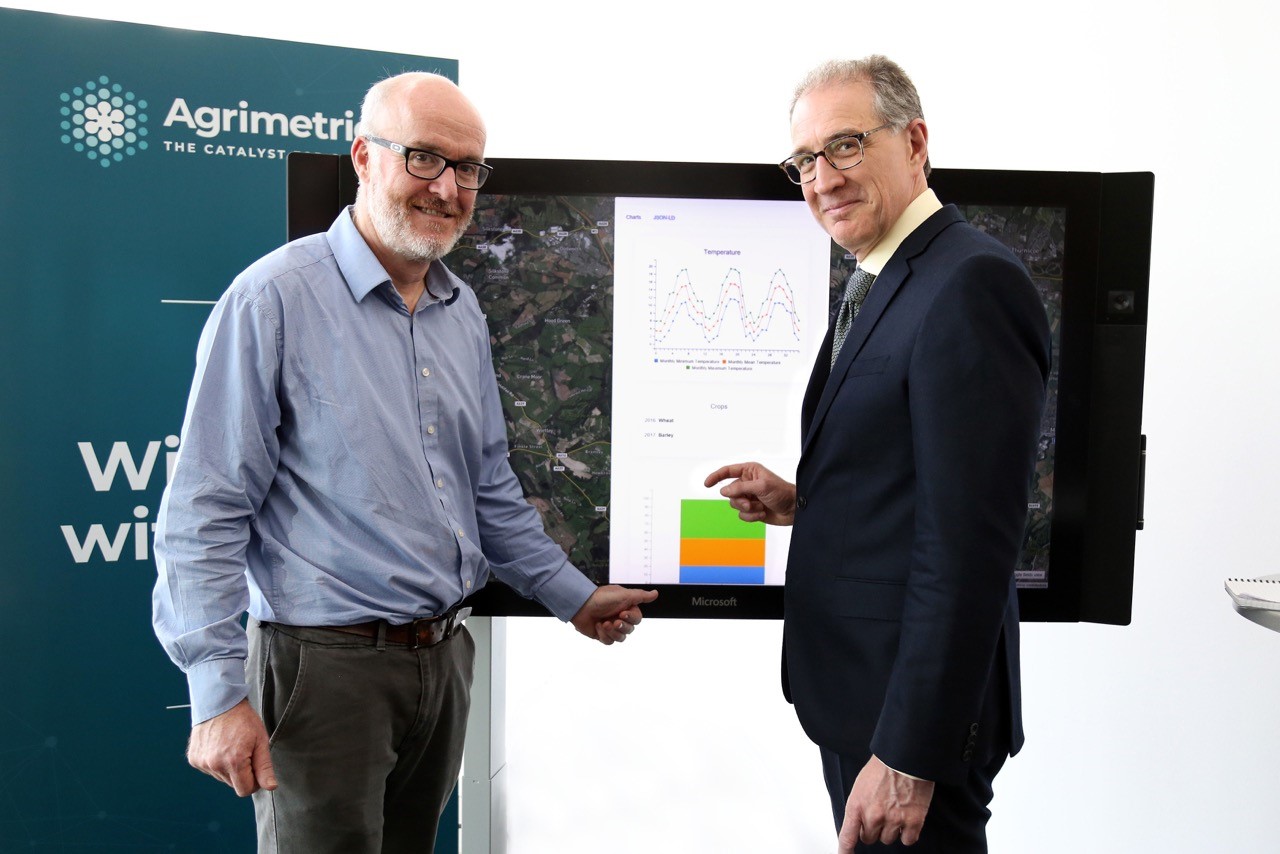
David Flanders (right) with Agrimetrics CSO Prof Richard Tiffin.
Agrimetrics was created in Oct 2015 with Government, academic and industry backing to unlock the value and insights held in data being generated across the agrifood sector. It’s one of four Agri-Tech centres funded by Innovate UK to drive greater wealth, productivity and efficiency across the UK agrifood sector.
To date, it’s cost about £10M in public funding, so what’s that achieved? “We’ve created a fast-growing data resource and a data platform for the agrifood sector. It’s not a storage platform, but a set of connections – a data infrastructure – that will allow individuals and companies to share data and bring it together,” says David.
Agrimetrics is using artificial intelligence powered by Microsoft Azure – the industry standard set of cloud services. This takes information and makes it available on a global network, using connections to form an agrifood ‘ecosystem’ of data. As new data is added the connections are extended.
So how is new data added? Generally the data, although it relates to farmers and to the land they farm, is not held by farmers. “We are farmer-focused, but we’re not farmer-facing,” explains David. Initially his target is agribusiness concerns that hold large amounts of land-based data.
He recognises that this data ecosystem will only be of value once there’s a sizeable amount of data being shared, and there’s still the problem that data in agriculture is siloed. This is where the Application Programmer Interface (API) comes in, explains Agrimetrics’ Simon Davis.
“The first step is to investigate the data. We need to know the granularity, so whether it’s farm-level, field-level or regional-level, for example. Then we have to look at the robustness and quality of the data.”
This process helps set up the API, which is the portal between the data and the wider ecosystem. It acts as both translator and control, so creates the links that bring the data into the Semantic Web, and regulates how much and to what level of detail is made available and to whom. “It can pull in data and enrich yours with all sorts of other data.”
This is achieved through a dashboard set up by the Agrimetrics team. “The more data we have access to, the more relevant and valuable it becomes as a tool that can help your business or your clients.”
But clearly, there’s not much incentive for the early adopters, which is why, along with setting up the data infrastructure, Agrimetrics has also pump-primed it with data. It spent two years collating data perceived as useful and insightful for the industry and made it available in a consistent format so that the datasets can be cross analysed.
Public and acquired databases that can be accessed include those from the UK Met Office, Natural England, Environment Agency, ISRIC (International Soil Reference and Information Centre) and NASA.
This big data has been made user-centric through Field Explorer, an API that gives access to environmental, soil and crop data through a ‘map of fields’, created by Agrimetrics from earth observation data provided by Airbus. The data has been used to create digitised field characteristics that allow you to compare and exchange best practice on agriculture across the UK.
But it hasn’t all been plain sailing, reveals David. “Much of this is publicly held data, but we still had to pay to gain access to it – effectively the taxpayer has had to pay twice. There are a number of public datasets that still aren’t available, and we believe they should be.” These include Rural Payments Agency and Ordnance Survey data.
But integrity and security remain key concerns – is this really the industry standard, and how secure is the data that’s shared? David believes the reassurance comes from the fact that it is Government-backed. “It’s better that data is held on an open, shared platform than controlled by one or two large multinational corporations. What’s more, although shared, the ownership of the data remains with whoever makes it available – they control the level of detail that’s shared,” he says.
A number of public and research-based applications are already making use of the data and the infrastructure behind them. Natural England is using a dashboard developed by Agrimetrics that gives an assessment of natural capital at a parish level. Data Combine gives growers direct access to crop benchmarking data.
“The infrastructure is now there for anyone to use and provides a framework to help inform the supply chain,” says David. “Initially I can see this will be of real value in the fresh produce sector, for example, to help companies understand when to plant to get the best quality product on the supermarket shelf and where there are risks to supply. But ultimately Agrimetrics is an important catalyst to help feed the world.”
What is the Semantic Web?

Tim Berners-Lee.
Over the past two days more data came into our lives than from the beginning of time until 2000, and the amount of data generated is accelerating.
“Hidden amid all of these data is the key to knowledge about how to cure diseases, make more money and govern our world more effectively,” says Tim Berners-Lee. There’s also the knowledge that allows farming to progress – the solution to blackgrass, the secret to lifting off the yield plateau, the key to overcoming drought stress, for example.
The reason we don’t yet have answers to these problems is that they only come about by finding the relevant bits of data and linking them together. So finding not just one needle in the haystack, but many, and then bringing all the relevant ones together to complete the matching set.
That’s where the Semantic Web comes in, explains Tim. “It uses the same basic technology that has made the worldwide web so successful: the link. The power of the web today, including the ability to find information quickly, derives from the fact that people publish documents in standard formats, and then link them together.”
This standard format has been followed by everyone who’s published a paper or a document on the internet about blackgrass. So type the word into your search bar and the clever bots at Google have already linked all the blackgrass documentation together and deliver the results quickly to your PC.
“The Semantic Web derives its power in a similar way, but through the linking of data rather than documents.” The algorithms and bots can cleverly find relevant data – wherever they are – and link them together.
The snag with data, however, is that they’re compiled in a whole mish-mash of different ways. You probably have a complete record of blackgrass incidence on your farm, for example, from Gatekeeper records on spray applications, to sketch maps of fields to what sits in your head. They need to be in a standard format and language for the bots and algorithms to understand them and then link them together.
The good news is that those standards exist, and a data compiler worth their salt can, in theory, knock your data into shape. That not only means the bots and algorithms can get to work linking all your data together, but it puts the power of the entire Semantic Web at your fingertips. You can share your data with others and draw in data that’s relevant to you.
The other aspect to this is that data can collectively be used by researchers to find new solutions. It’s been some time since a blockbuster solution to blackgrass appeared on the scene, for example, and growers are now largely resigned to the fact that’s unlikely to happen.
There’s a similar problem throughout life sciences, notes Tim. “Researchers are coming to the conclusion that no single lab, library or genomic data repository contains the information necessary to discover new drugs.”
As with diseases, the information needed to understand the complex interactions between blackgrass, the soil, the biological processes and the vast array of chemical agents is probably spread across disparate databases, spreadsheets and documents.
“As a result, progress towards a better solution may depend on technologies that enable sharing and integration of data, as well as on changes in institutional practices in order to allow exploration of the links in these data.”
But Tim’s not suggesting companies simply free their data. “Rather that they explore more flexible licensing models that allow greater value to be created through the combination of their own intellectual property and that of others.”
For this sort of integration to happen, an essential technical step is to publish the data using Semantic Web standards, and to link them together with definitions of the terms used to express the data, he says.
“For example, when publishing experimental results about the behaviour of a particular chemical in a larger biological process, one must indicate which vocabularies are being used to describe the biological pathway and the chemical. Then, when someone else wishes to integrate those data—for example, with other experiments documented in the research literature—that person can use that same vocabulary to match article keywords to chemical names.”
The key to this integration is to use common data formats that link the information with identifiable vocabularies. “The Semantic Web doesn’t require that everyone use the same vocabulary, any more than we can expect the entire world to speak a single language. Instead, it provides tools for the translation from one set of terms to another. These translations will integrate larger and larger collections of information across the web,” explains Tim.
- Adapted from article in The Economist, Nov 2006
Data combines to ASSIST benchmarking
Agrimetrics is working with the ASSIST (Achieving Sustainable Agricultural Systems) programme to show the impact of environmental conditions on crop performance.
Its new Data Combine benchmarking tool captures farm yield data from farmers participating in the programme led by the Centre for Ecology and Hydrology. Part of the project has been to analyse large volumes of crop yield data to determine how factors such as soil, climate, landscape and management affect yield performance over time.
“We want to provide farmers with an easy way of benchmarking their yield against identical crop varieties grown under similar environmental condition,” says Professor Richard Pywell of CEH. “This will help us understand and ultimately overcome the factors holding back crop yields.”
The ASSIST programme aims to develop and assess novel mid- and far-horizon agricultural systems and technologies to gain an understanding of how sustainable intensification might increase production and impact on the environment.
“This study will provide unique insights into what management practices work best on UK farms,” says Richard. “As the data builds up it will be possible for farmers to compare their crop performance with that grown under similar conditions and identify which innovations and strategies will be most beneficial.”
Currently the ASSIST programme has been granted access to yield data for over 2000 fields across the UK and is currently analysing very detailed precision yield data for a further 800 fields. To handle the large volumes of data involved ASSIST has developed new automated ways of rapidly cleaning and analysing yield data. The team are keen to encourage more farmers to get involved.
Data Combine can run on the office computer and information from other packages such as Gatekeeper and Muddy Boots can be copied across. The idea is that the more information put in, the more value those participants will get back. http://datacombine.agrimetrics.co.uk
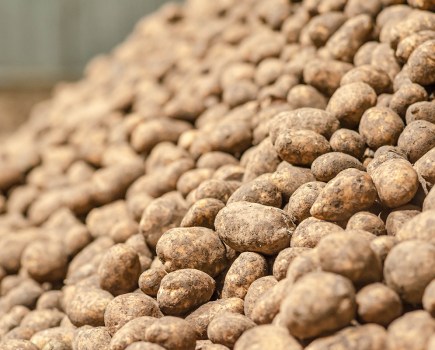
Delivering data on predictable distribution
Potato growers and suppliers are now able to predict tuber size at harvest by connecting data captured on varieties, solar radiation and canopy development.
NIAB has collected this information over many years, to build a reliable prediction of potato yields and tuber sizes. Agrimetrics has now used this data algorithm to create the NIAB-CUF Potato Yield Model app.
Traditionally, growers estimate yield ahead of harvest by digging up a plant and counting the number and size distribution of tubers. Asda’s growers are now using smart phones to upload photos of their crop throughout the season.
Intelligent software uses these images to assess the crop’s potential in relation to data from local weather stations and historical data. A yield report then helps them make decisions earlier in the season that will reduce the risk of gluts or shortages, at farm and retail level.
“It’s very important for growers to be able to harvest their crop when they have an optimal distribution of the different sizes of tubers,” says NIAB’s Mario Caccamo. “If you know this in advance, you’re in a good position to respond to the demands of the market. More potatoes of the right size mean bigger profits.”
At the end of the season, growers can use the data to understand how to improve management of the crop in subsequent years to produce higher marketable yields.