
A service has just launched, free to UK growers in 2018, using a new network of satellites to bring accurate crop yield prediction. CPM gets exclusive insight
In five years’ time every agronomist and farmer will be using data in this way to make better decisions.
By Tom Allen-Stevens
Look at your wheat crop and take a punt on what it’ll yield. You’ll probably make a pretty good estimate, and this may already be written into budget forecasts. It’s what you’ll likely peg your grain-marketing position on, your input purchasing decisions this spring, and whether you should put down a deposit on that new combine.
Those are fairly weighty decisions, all based on best guestimates that rely on two factors: the weather between now and harvest and your own ability to assess the state of your crop. While no one’s suggesting you can accurately predict what the weather will do, Wilts-based digital farming specialists AgSpace have just launched a new system available via Intelligent Precision Farming (IPF) and Agrii’s SoilQuest with claims that it accurately predicts crop yields from as early as GS37.
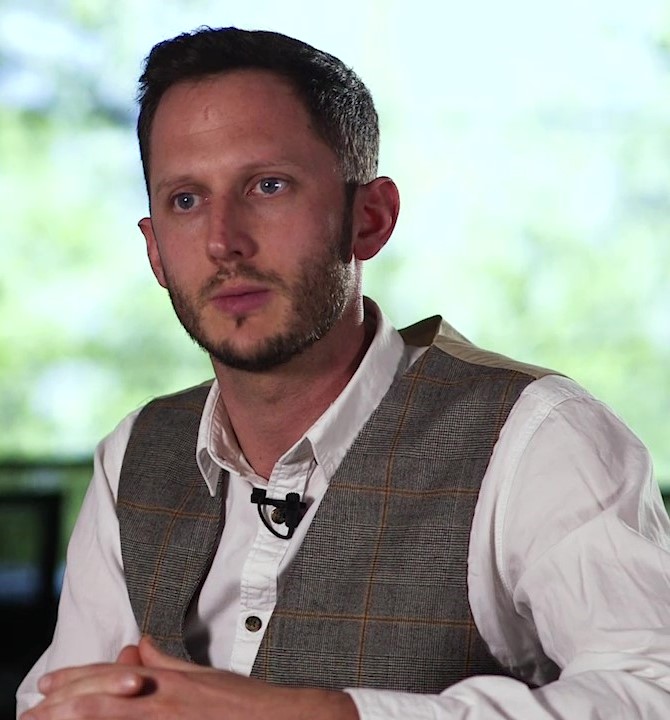
Vince Gillingham
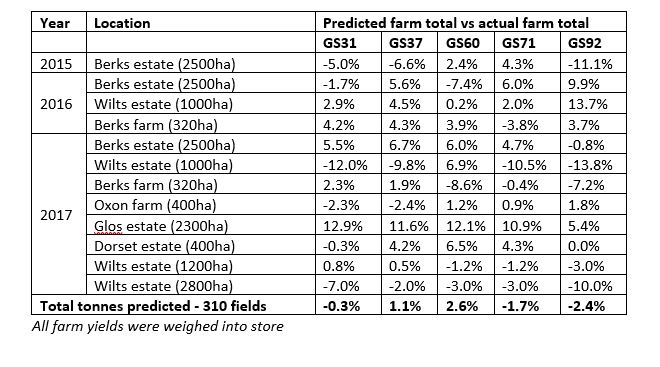
“Testing we’ve done over the past three years has shown we can predict wheat yields to within 10% of actual harvest result. In fact in 2017, the predictions we made at GS37 were more accurate than those closer to harvest,” states AgSpace’s Vince Gillingham.
So confident is he in the reliability of this new service, it’s being offered to any UK farmer completely free of charge for a trial period. “Farming is changing rapidly – there are new tools that one day will become a standard part of agronomy practice. We want to give farmers the tools now that will be part of this future,” explains Vince.
So just what are these “tools”? The new service is called Contour. It’s based on data gleaned from Sentinel radar satellites, hyper local weather (that pinpoints your farm, brings in weather data from a range of sources and includes soil temperature and moisture levels) and daily optical satellite data. All you do is upload a map of your farm and Contour pulls in the latest data. It applies some clever algorithms to assess growth stage, leaf area index, green area index, crop biomass and a number of other variables, and what you get back is accurate information on predicted yield, and optical satellite data, provided at up to a 3.5m resolution, that’s updated as the season progresses.
“The service is currently available for winter crops – wheat, barley and oilseed rape. It takes three years to develop and test the crop growth models for a new crop, and what we’ve launched this year is the culmination of four years’ hard work. Future crop models will be backed by an investment of €17M by our parent company and University College Dublin,” continues Vince.
It’s a logical progression for the company, he says, that was started by his grandfather in the 1960s and became the Courtyard Partnership, a soil science consultancy for farmers. “We started with a focus on soil health, and that remains to this day. But we’ve layered on the technology,” says Vince, who joined the family business in 2003.
This is when the company introduced its precision farming services, now known as the Toolbox with IPF and Agrii Precision Services (APS) via SoilQuest. “What we’ve always focused on is the creation and management of soil zones – different regions within a field defined by the soil properties. The farmer and agronomist decide these together, based on scans and their own local knowledge.”
Built into this is Insight – the “clever stuff”, he says, which uses satellite data to help generate application maps based on soil health, crop performance and yield potential.
But Contour brings in something totally new, explains IPF general manager Max Dafforn. “Older satellite imagery gave you a very accurate picture of Normalised Difference Vegetation Index (NDVI) – the measure that can be used to gauge leaf area index variability. But this changes as the crops grow in the spring, so the relevance of the satellite data depends on when the satellite last flew over and whether there was any cloud cover. That’s quite a limitation in the UK.”
The new bit is SAR – Synthetic Aperture Radar. “Radar penetrates the cloud layer and measures crop texture, taking readings day and night. The satellite effectively sees the crop in 3D. It’s a bit like walking through the crop with your eyes shut and feeling it,” he explains.
Radar penetrates the cloud layer.
The Contour service fuses SAR, hyper local weather and NDVI data to deliver a very accurate picture of crop biomass, he continues. “The yield prediction was actually an unexpected outcome of the project we set up to explore the technology. Our scientists noticed the correlation early on that stayed true throughout the season.”
Relating crop biomass to yield potential is nothing new – the research that underpins the AHDB Wheat Growth Guide is well established, and forms the fundamental basis for crop potential determined in the Yield Enhancement Network (YEN), for example. But accurately measuring crop biomass is somewhat harder, and to do so without even touching the crop or flying a drone is the achievement that makes the service unique, he claims.
The yield prediction, however, is still very dependent on the vagaries of the Great British weather. “The model uses daily data on solar radiation, so crop potential can obviously go down, such as what happened in 2012. The clever thing about the model is that it knows where the crop is in its cycle, so makes in-season adjustments.”
This means farmers can adjust fungicide strategies, for example, mid-way through the season to take account of crop potential. “You can tell if the crop is behind or ahead of the curve of its yield potential – it’s very empowering.”
So why isn’t everyone using SAR? “Anyone can now get the data for free,” notes Max. “But it’s pretty useless unless you develop an algorithm that fuses it with the NDVI data, and then uses weather modelling and wheat growth data to predict how the crop will develop. You then have to ground truth it and test it over several seasons.”
The process for AgSpace started before the Sentinel data was available, and much of the investment was spent on purchasing data of the right type and resolution from commercial satellite services, Vince points out. “The reason we’re the first global player that can offer this service is that we started the R&D and developed the system before Sentinel was even launched.”
The concept has been demonstrated and ground-truthed, involving a network of 30 farmers. “We wanted to be within 90% accuracy before we launched the service. We’ve achieved that now.”
Free for the first season, those who wish to continue will pay £2/ha per year for daily satellite images, hyper local weather, growth stage prediction, GAI data and yield prediction. Various services like precision soil analysis and precision fertiliser plans from IPF and SoilQuest can be loaded on top, adding an extra £1.60-5.80/ha.
But the ownership of the data remains with the farmer, he stresses. “Farmers who opt out of the service can have their data removed.”
The software is available across a number of platforms, including iOS and Android smartphones, he adds. “You don’t need any GPS tools to make it work – you just flick on your phone and it’s there, with data that’s regularly updated. In five years’ time I reckon every agronomist and farmer will be using data in this way to make better decisions. It’s what precision farming should be – simple, easy to use, informative, open and secure.”
- CPM has taken the new service for a test run. More can be found at www.contour.ipf-uk.com
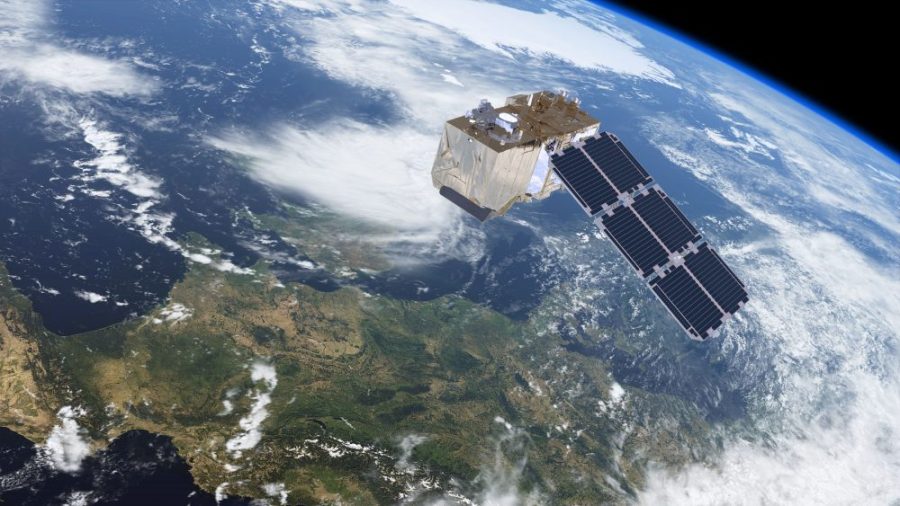
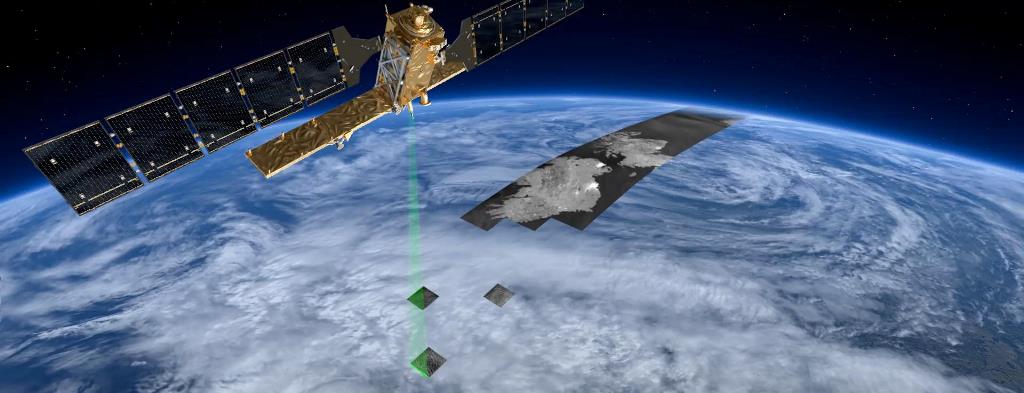
Sentinels watch as crops grow
The Sentinel family of 14 satellites is part of the European Space Agency’s ambitious Copernicus programme. They’re designed to deliver a wealth of data and imagery, monitoring land, sea and atmosphere. Different instruments send back information on anything from crop cover to natural disasters to shifts in global plankton concentrations.
There are six Sentinel missions in total, with Sentinels 1 and 2 probably having most application to agriculture – Sentinels 3 and 6 monitor oceans and water, while Sentinels 4 and 5 scan the Earth’s atmosphere.
Sentinel-1A was the first in the family to be launched in April 2014, joined by its identical twin, Sentinel-1B, in April 2016. By orbiting 180° apart, they cover the globe once every six days to a resolution down to 5m.
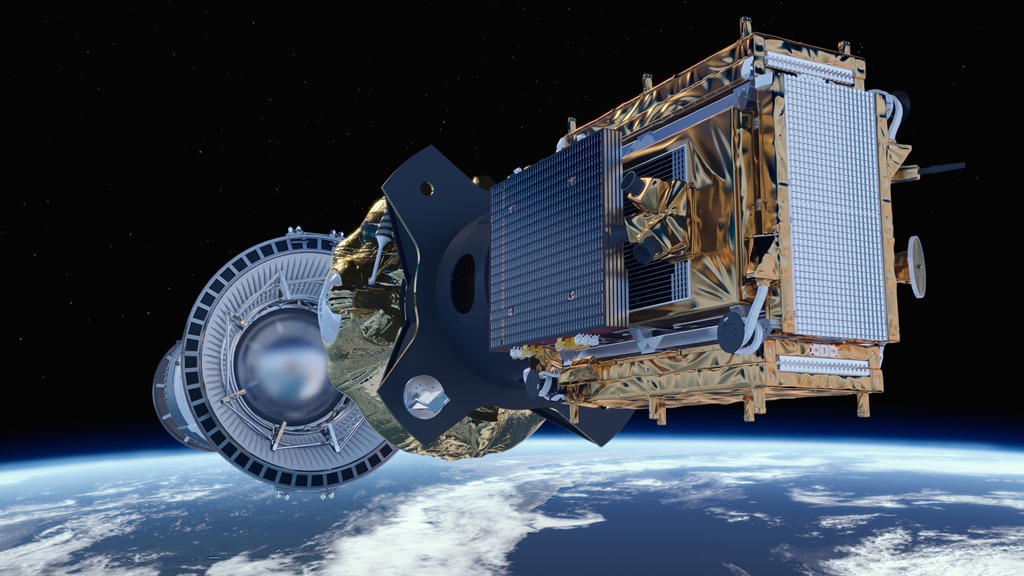
The two new Sentinel-1 satellites can scan the surface of the earth in just six days.
What’s interesting about these celestial spies is that they scan the Earth’s surface using radar, so can ‘see’ through cloud and rain, regardless of whether it’s day or night. The radar interferometry remote-sensing technique combines two or more radar images over the same area to detect changes occurring between acquisitions. Even slight ground movement, down to a few mm, is picked up across wide areas, allowing Sentinel-1 to track changes in the way the land is used with exceptional accuracy, claims ESA.
Sentinel-2A was launched in June 2015 and Sentinel-2B followed in March 2017. These each carry a high-resolution multispectral imager with 13 spectral bands, offering a resolution down to 10m across a swath width of 290 km. Similar to Sentinel-1, this constellation orbits 180° apart, covering all Earth’s land surfaces, large islands, inland and coastal waters between 84°N and 56°S every five days.
These are the images that can detect crop type, determine leaf area index, leaf chlorophyll and water content to monitor plant growth and health, providing the data to predict yield.
EC-funded, all the data and imagery are available free, to those with the server space to store them, to encourage as many applications and as much usage as possible. With over half the family now in orbit, most of the satellites have an expected lifespan of around seven years.
SAR yield prediction summary 2015-17
Keeping a watch on crop biomass
Understanding how the biomass of his crop develops is a key requirement for Duncan Lee, manager of the Ramsbury Estate on the Wilts/Berks border. He tried out a pilot version of the new Contour software across his 2700ha of arable cropping, among which there’s hybrid rye grown for an anaerobic digester.
“You need updated information because the crop grows so quickly. There’s scope to make in-season changes and respond to how the crop is putting on biomass. I think this is the beginning of a new platform that will become the basis of a lot of decision making.”
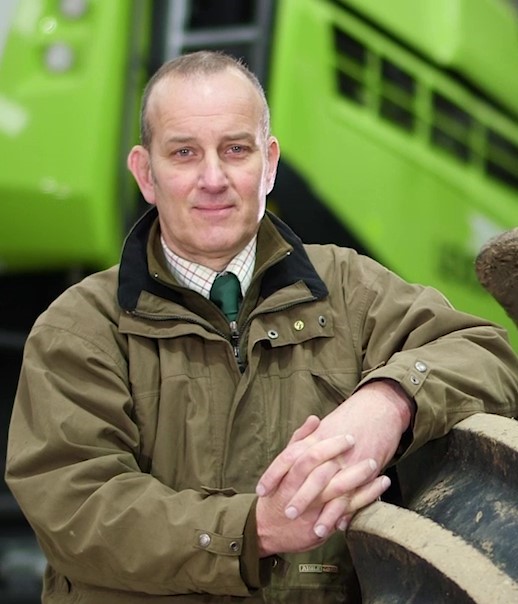
Duncan Lee
The soils on the farm vary from black puff all the way through to chalky clay loams with plenty of flints. Clay caps within fields of otherwise chalky soils are typical of land in the area.
“We were the first farm to have our fields zoned by soil type by the Courtyard Partnership, moving away from the inaccuracies of sampling in a W-pattern. Broad-brush spreading of inputs simply doesn’t work with us – it’s much more accurate to apply nutrients to where they’re needed.”
More recently he’s used the IPF Toolbox, that draws in satellite data to inform application decisions. “I’ve found satellite data very useful in terms of the information it brings you about the state of the crop. The problem with drones is that it takes a while for them to map fields and just a slight change in the light levels while it’s scanning can compromise the value of the data you get back.
“The big drawback with satellites has always been that the maps haven’t been up to date, and have relied on no cloud cover. The IPF platform is also now a bit dated – the software can be slow to load and a bit clunky with all the data it handles.”
The new Contour platform is completely different, however. “The software is brilliant – you click on a button and away you go, it’s very responsive. The relevance of the data has vastly improved now it pulls in the radar-generated satellite maps and you get a lot of very useful weather data,” notes Duncan.
The regularly updated information on biomass and crop moisture content are just what’s needed to monitor the AD crops as they reach maturity, especially in fields where crop density varies. He believes there’s also a lot of scope with the yield prediction function. “It predicted within 3% what our wheat yield would be at growth stage 37. What it can’t take account of is unusual future weather events – we had four fields of second wheat where the yield potential just fell apart following the hot weather we experienced in June and July.”
But would he use the data to trim back inputs? “We still need to work out just how to use it. There were certainly a couple of fields predicted to yield well, and you could justify pushing them harder with perhaps a T4 fungicide application. For milling wheats, it would identify higher yielding areas to boost nitrogen and maintain protein levels. It’s another tool that certainly has potential to help you get more from your crop,” he concludes.