In this special edition of Pulse Progress, CPM explores how the development of a new modelling tool could revolutionise the forecasting of maturity and yield in vining peas.
“With the increasingly hot summers that we’ve been getting, it’s going to be even more crucial to accurately predict harvest dates.”
By Charlotte Cunningham
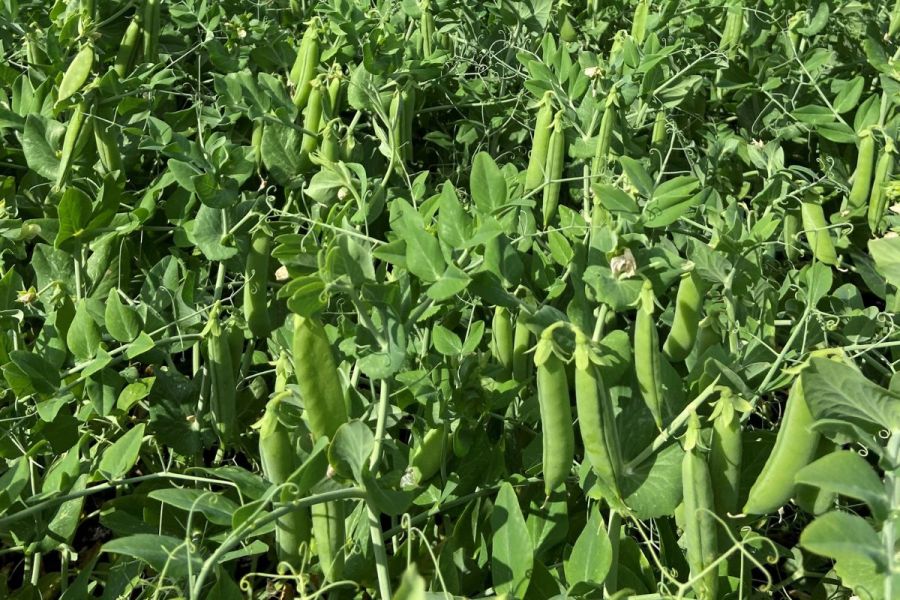
Anyone who’s grown vining peas will know firsthand what a notoriously unpredictable crop they can be.
Vining peas typically have a very short harvest window – often only one or two days — which can be expedited by hot weather. This effect was seen in full force last summer, with the hottest June on record creating far from ideal conditions for crops across the country.
As well as the obvious negative impact on yield, the challenge with these fluctuating weather patterns is that it makes the advanced prediction of harvest dates difficult, explains Leah Howells, data scientist at PGRO. “With the increasingly hot summers that we’ve been getting, and the Met Office predicting this to continue, it’s going to be even more crucial to accurately predict harvest dates.
“We’re also seeing highly unpredictable yields. While high and low yields can be estimated using pod and seed counts, there’s currently no standard method of prediction.”
At present, measuring the maturity of peas is done via grower groups sending out fieldsmen to each field to take tenderometer (TR) readings to see if the crop is ready or not. This manual process isn’t only inefficient, but it disrupts harvesting schedules and makes intake management at the freezing plants challenging, meaning some fields can be left to go over, or loads can be rejected if they’re over capacity, explains Leah.
It was this challenge that sparked the idea to develop a tool that uses algorithms, crop data, weather patterns and other variables to give grower groups accurate forecasts of when individual fields will be ready.
The PGRO project, which has been partially funded by Innovate UK, commenced in 2019, with the objective of reducing wastage caused by crop bypassing and inefficient factory processing through the advanced forecasting of harvest dates and yields in vining peas. In doing so, this would allow processors and growers to anticipate the peaks and troughs in vining pea production to ensure that crops aren’t reaching maturity too quickly to be processed.
The development of the tool has been based on machine learning, explains Leah. “Machine learning is an example of what AI can do and how it can be used practically in agriculture.”
In terms of the information that went into the machine learning models, the research team started with a huge body of commercial historic vining pea crop data, she adds. “This comprised more than 18,000 crops grown between 2001 and 2023 and included all key crop information such as drilling, flowering and harvest dates, as well as variety information and quality – the TR – and yield at harvest.”
This was combined with satellite data which provided the research team with multispectral canopy reflectance measurements, derived from the Sentinel-2 system, and daily weather data.
“These data sources were fed into the machine learning models to produce two separate models as a result – one for harvest date and one for yield,” explains Leah. “These models essentially find trends and patterns in the data and then can apply that to any new data which comes in, in order to generate predictions.
“As a result, we were able to generate predictions which are more accurate and further in advance than is currently possible for vining peas.”
The models can make predictions from full flowering onwards, which gives growers a lead time of around 10 days ahead of harvest, compared with just a few days when using TR readings alone, she adds. “This results in a window of certainty around harvest date, which in some cases can half the number of quality samples that have to be taken in the approach to harvest in any given field.”
In terms of accuracy, Leah says for the harvest date model, the average error is around one day, whereas in the yield model, the average error margin is around 15%, which equates to about 0.7t/ha.
“For the harvest date model, we’ve found the most important data set to go into the platform is the full flowering date. While the multispectral canopy reflectance indices were most influential in the accuracy of the yield model because they provide a snapshot of the field as pod development is occurring and can give an indication of potential yield.”
One of the farms which has fed into the machine learning models is A & EG Heading in Cambridgeshire.
Farm manager Myles Forber says tools which improve the accuracy of maturity predictions could be a game changer for vining pea management. “We’re a family business based in the Cambridgeshire Fens growing potatoes, onions, cereals, sugar beet, maize for the onsite AD plant and vining peas.
“The vining pea enterprise has been a part of the business for a long time and is run entirely in-house – we do all the growing and the vining operation ourselves and we’re delivering into Princes.”
The farm is 1700ha in total with around 400ha of this down to the vining peas, making it a core part of the business, he adds. “The biggest challenge to our peas is the weather and the fluctuations we have in that peak growing window of flowering – which is anytime between June onwards.
“As we get drilling blocks that come together and have naturally less days growing, if we have a fluctuation in temperature, it has the potential to increase differentiation between them, which is when we start struggling to predict maturity accurately.”
Looking at the current system for maturity predictions, Myles adds that his biggest concern is not being able to predict more than a few days ahead. “We drill lots of different varieties. Obviously, they’ve all got different maturity dates, and the weather can impact this, but if that means a certain variety is going to overtake another one it really messes up that harvesting sequence.”
At present, the farm is testing maturity via a fieldsman coming out to measure TR levels, he explains. “However, generally this is only accurate for about three days ahead. Naturally, until we can get a TR reading from the pea, his task of testing is irrelevant. Therefore, if we can use flowering dates and machine learning, combined with TR readings, it helps us to more accurately plan everything from daily workloads to delivering into factories.”
Myles adds that the latter is particularly important due to the obligation of growers to have to alert factories of how many tonnes they have per day.
“When we get these predictions wrong, the implication is that we fall outside of the TR bracket that factories want. There’s a balance between being at 100 TR and where we want to be in terms of maximising yield, but there’s probably only about a day in that where we have to grab the peas before they’re out of sync.
“If this happens, crops end up being bypassed, left or taken in early. So with better tools, we’ll be able to make a more informed decision about harvest strategies.
“At the moment, we’re only able to make that decision three days ahead. But if I’m able to half make it a week or two in advance, and then only have to plan the key day-to-day operations three days ahead, our planning will be much more efficient.”
As well as the managerial benefits this brings to a busy farm business, there are also advantages from a practical farm management perspective, adds Myles. “For managing labour and irrigation periods, it’s quite key that we know what’s coming.”
Turning focus to the involvement with the new tool, Myles explains that while the business has been in contact with PGRO throughout the project, last year was the first year they sent data in to feed the machine learning development. This included variety, drilling date, field location, full flowering date and harvesting dates and the TR each field was harvested at. “We then met up just before Christmas to relay what our actual flowering and harvesting dates were, to compare it beside what Leah had forecast, and I was pretty impressed with the accuracy.
“All the way along, the model was clearly following the right trend lines, which is promising because the more data you put into tools like this, the more accurate the algorithms are going to be. Leah was also able to predict a TR window for a certain date, depending on which market we wanted to target, which is really useful.”
Looking to the season ahead, the farm will once again input their data into the model but will be using it as more of a management tool this year, explains Myles. “Leah has shown me how to input our information and it’s really simple. So as soon as it stops raining and we can get drilling, we’ll be able to start adding our data and managing the crop from there.
“My ideal scenario is that I can use the system to avoid me having to do the field walking every day to see what stage the peas are at, and I can share the data with the people doing the TR reading so they know what’s coming and plan their own routes which will make the management a lot smoother and free up that time for me – and them.”
Future steps
In terms of future plans, with the tool now in place and set for launch at the end of February, Leah believes it has the potential to revolutionise vining pea harvesting and processing. “The launch of the tool will enable both processors and growers to access the models and use them as part of harvest scheduling in vining peas.
“It’s a very simple interface – the only data that’s required is a small amount of crop information – as well as field location – which are uploaded into the platform and predictions are generated as a result.
“The platform automatically pulls together the satellite and weather data, meaning that predictions are generated and updated on an ongoing basis to help growers be prepared in an era of continually changing weather patterns.”
As for further developments, the nature of machine learning means it’ll be possible to adapt the models to fit any crop, adds Leah. “Providing there is a sufficient body of historic data for the machines to pick out trends, the potential is huge across all crops,” she concludes.
PGRO’s Vining Pea Forecasting Tool – key features:
- User authentication and secure login
- User-friendly interface, with minimal data input required from the farmer
- Yield and harvest date forecasts available from drilling
- Crop mapping function to visualise field boundaries
- Downloadable results table showing harvest date, yield and total tonnage for each crop
- Day-to-day harvest date visualisation using the planner tool
- Visual representation of daily total expected tonnage and hectares to be harvested, enabling peaks and troughs in production to be pictured
- True colour (RGB) and NDVI Sentinel-2 satellite imagery, with two new images available every two to three days in cloud-free conditions, giving users and aerial view of individual fields.
[Source: PGRO]
This article was taken from the latest issue of CPM. For more articles like this, subscribe here.
Sign up for Crop Production Magazine’s FREE e-newsletter here.


